Wasatch Mountains
Data ยท Reports

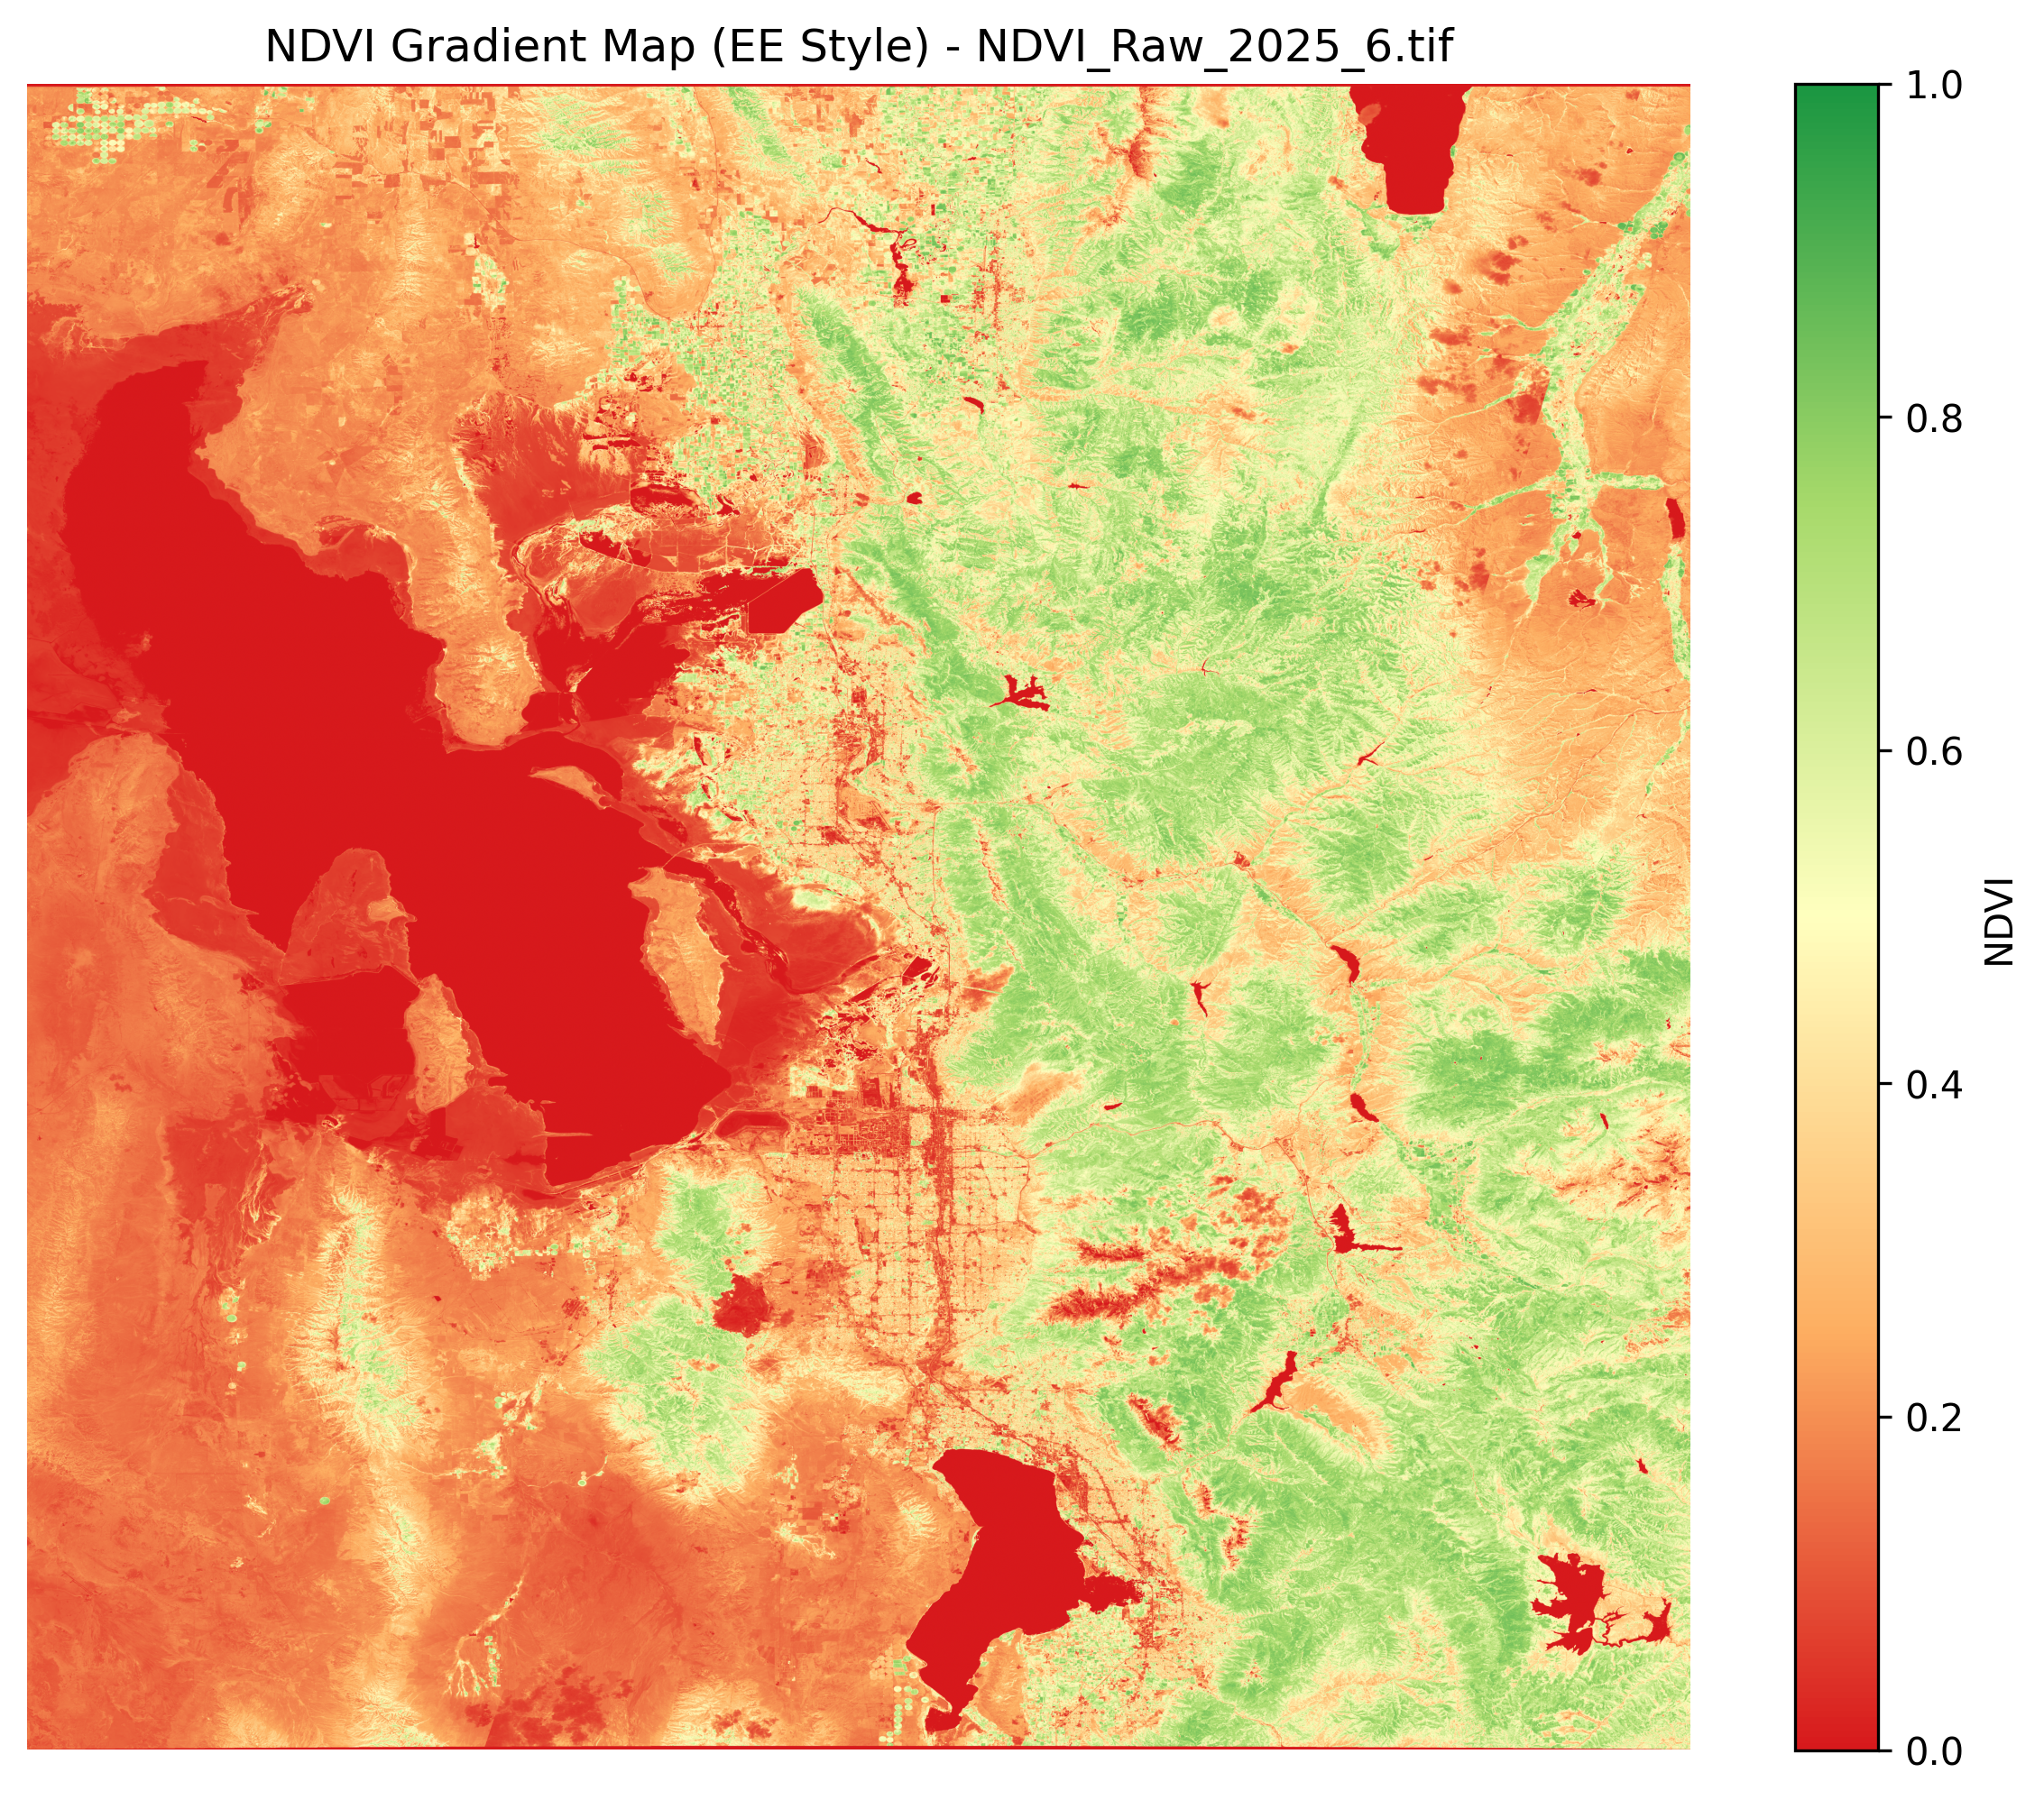
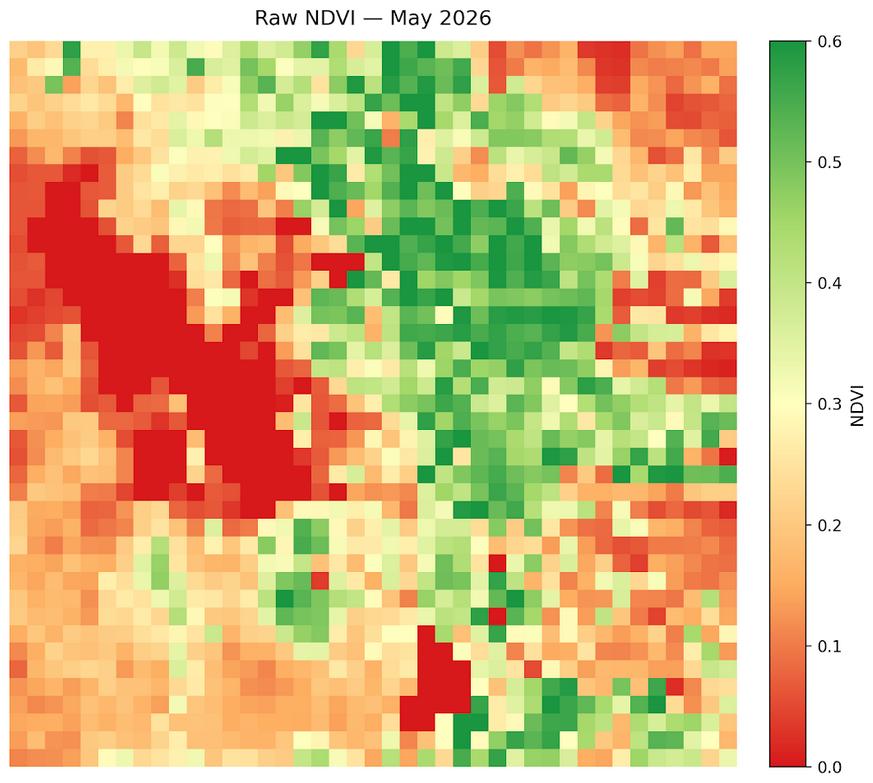
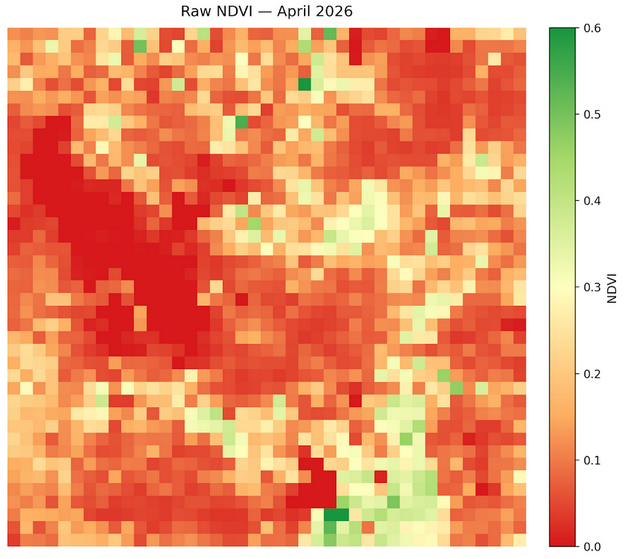
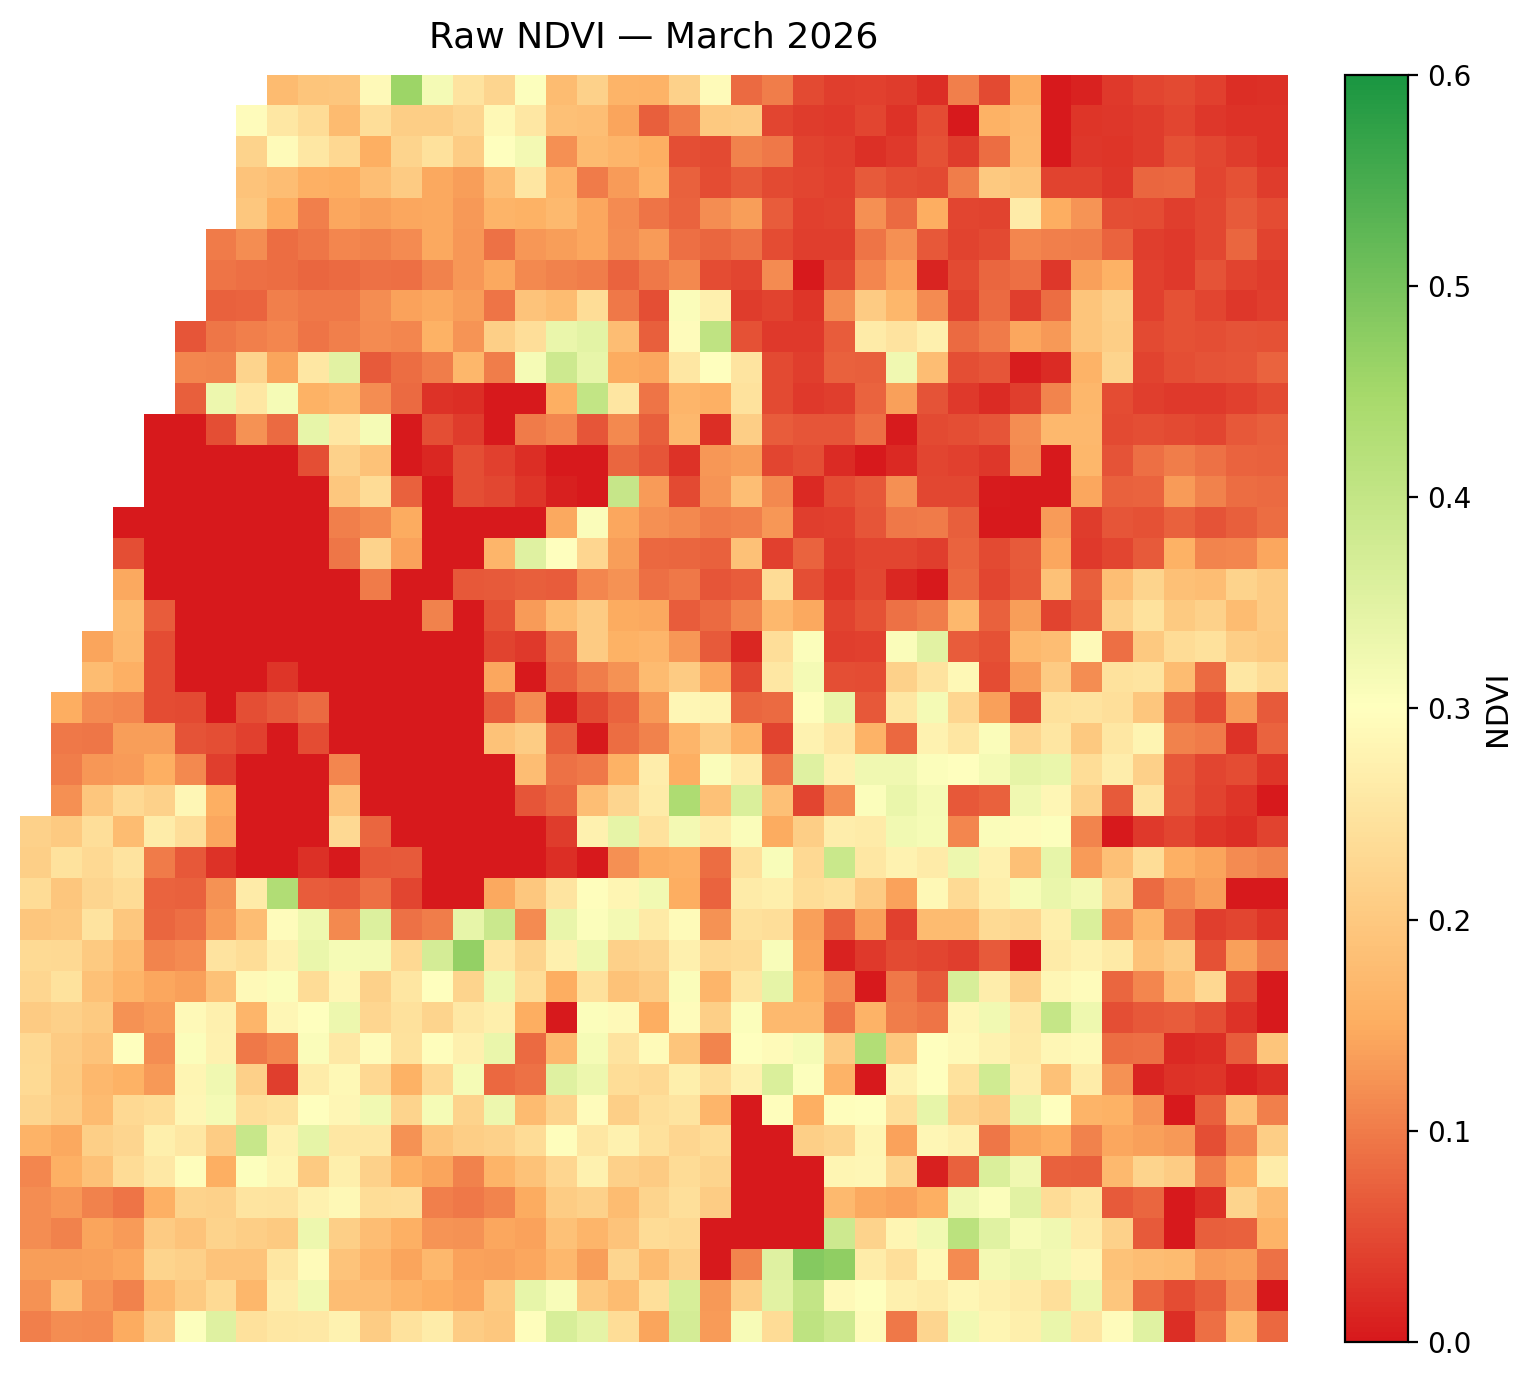
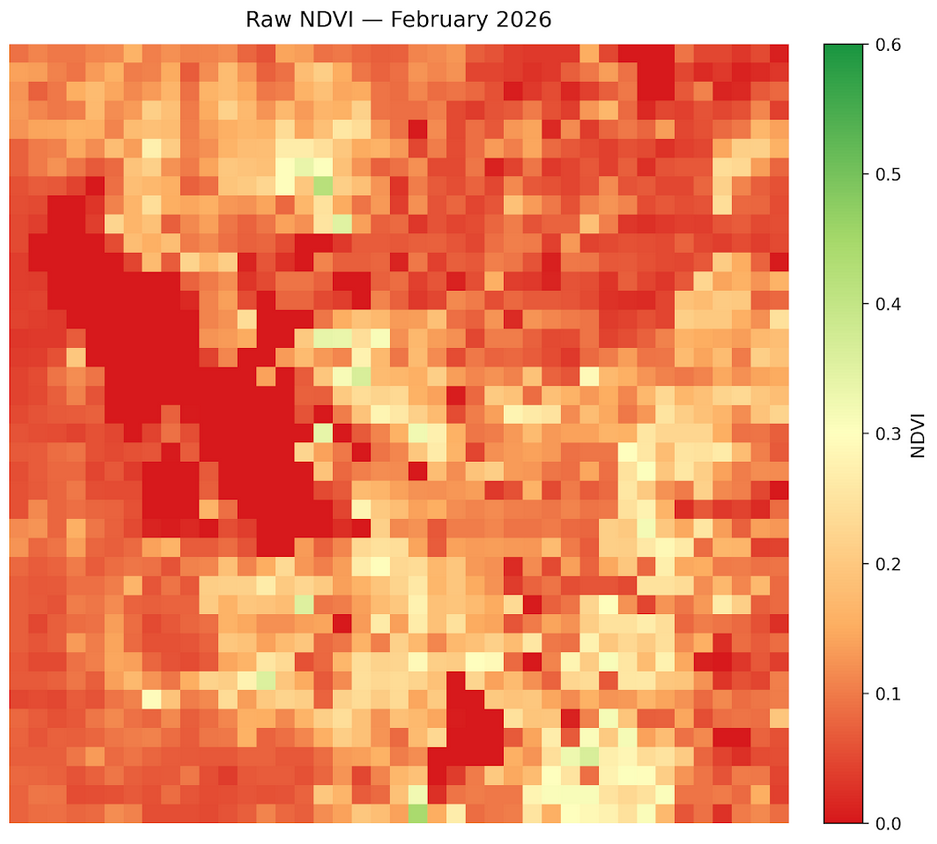
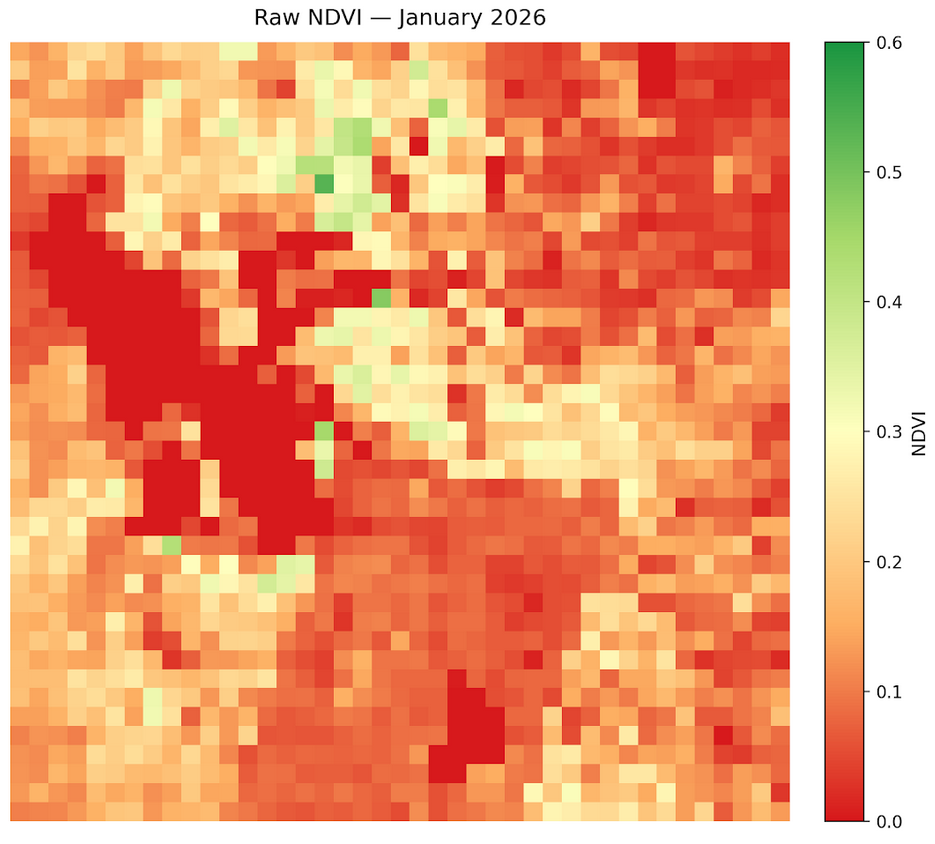
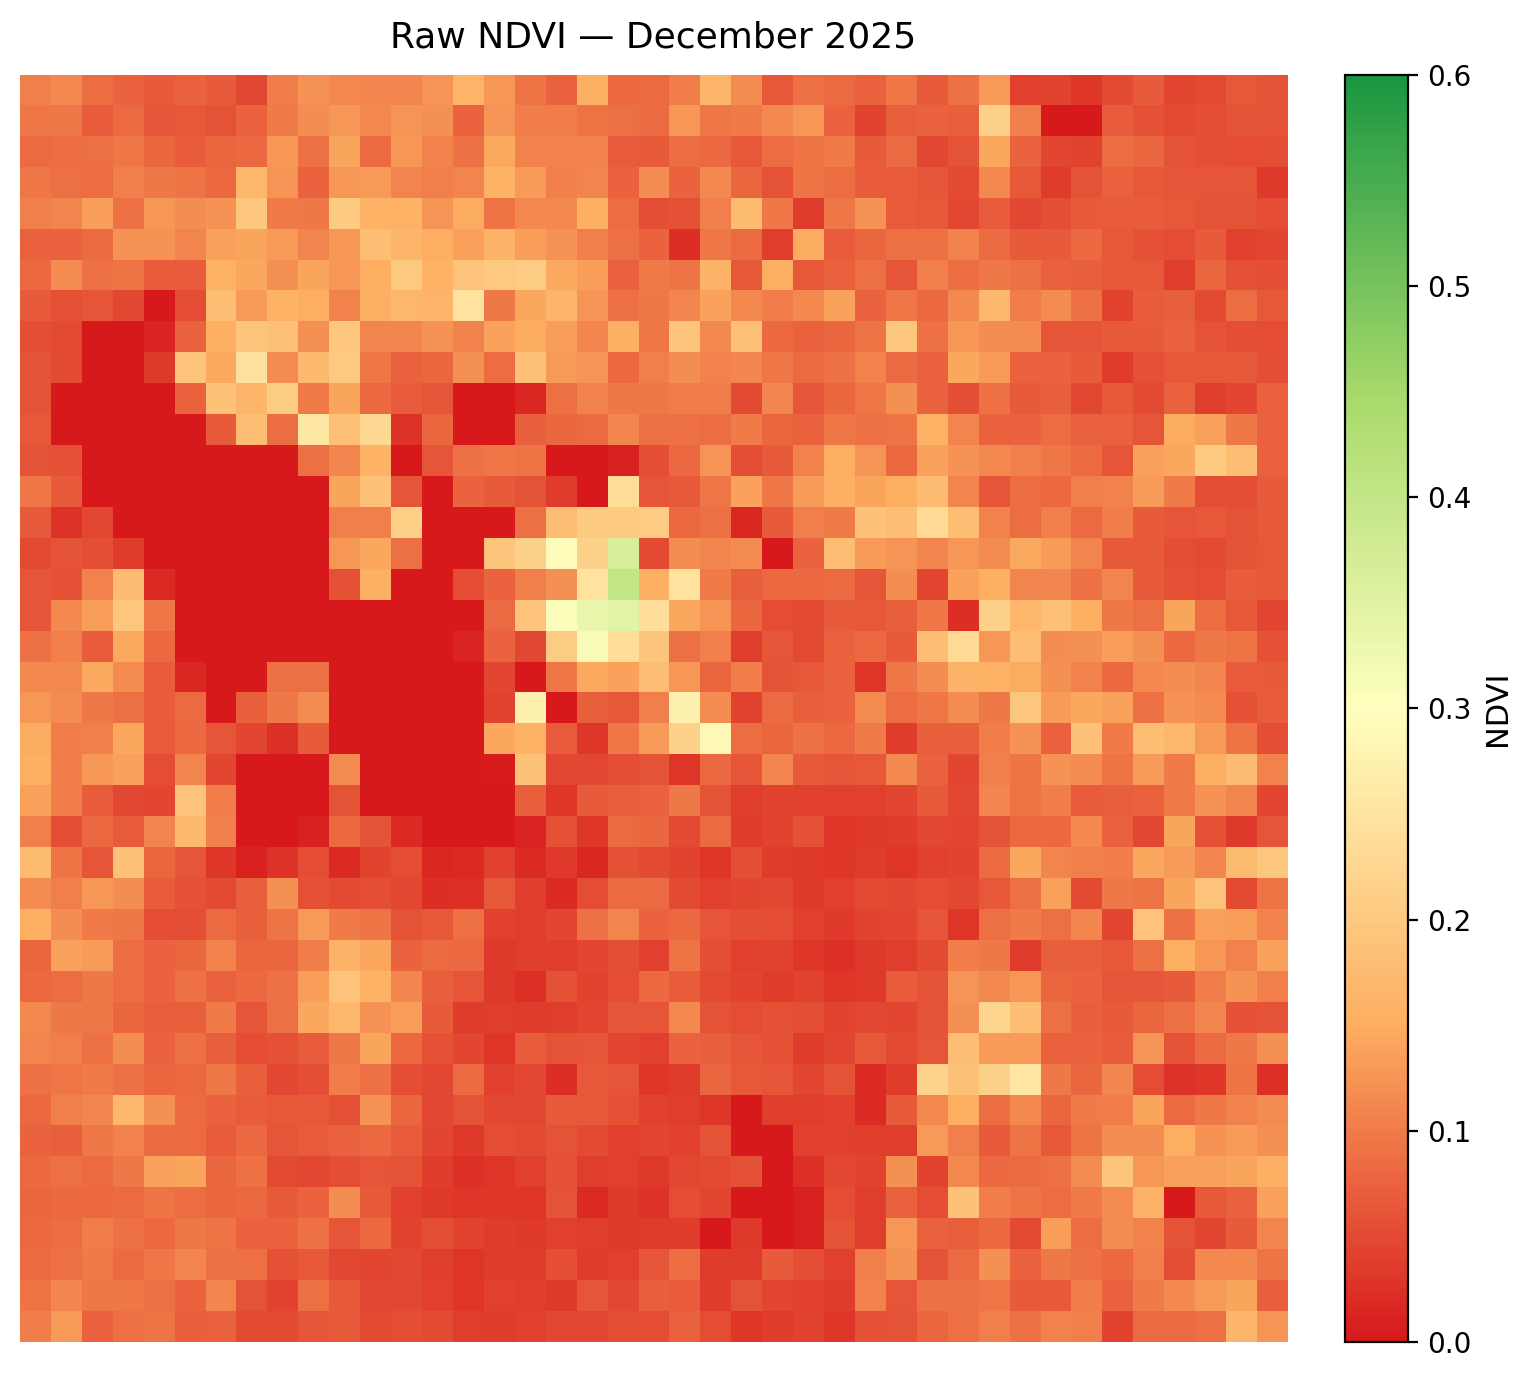
Monthly NDVI Reports

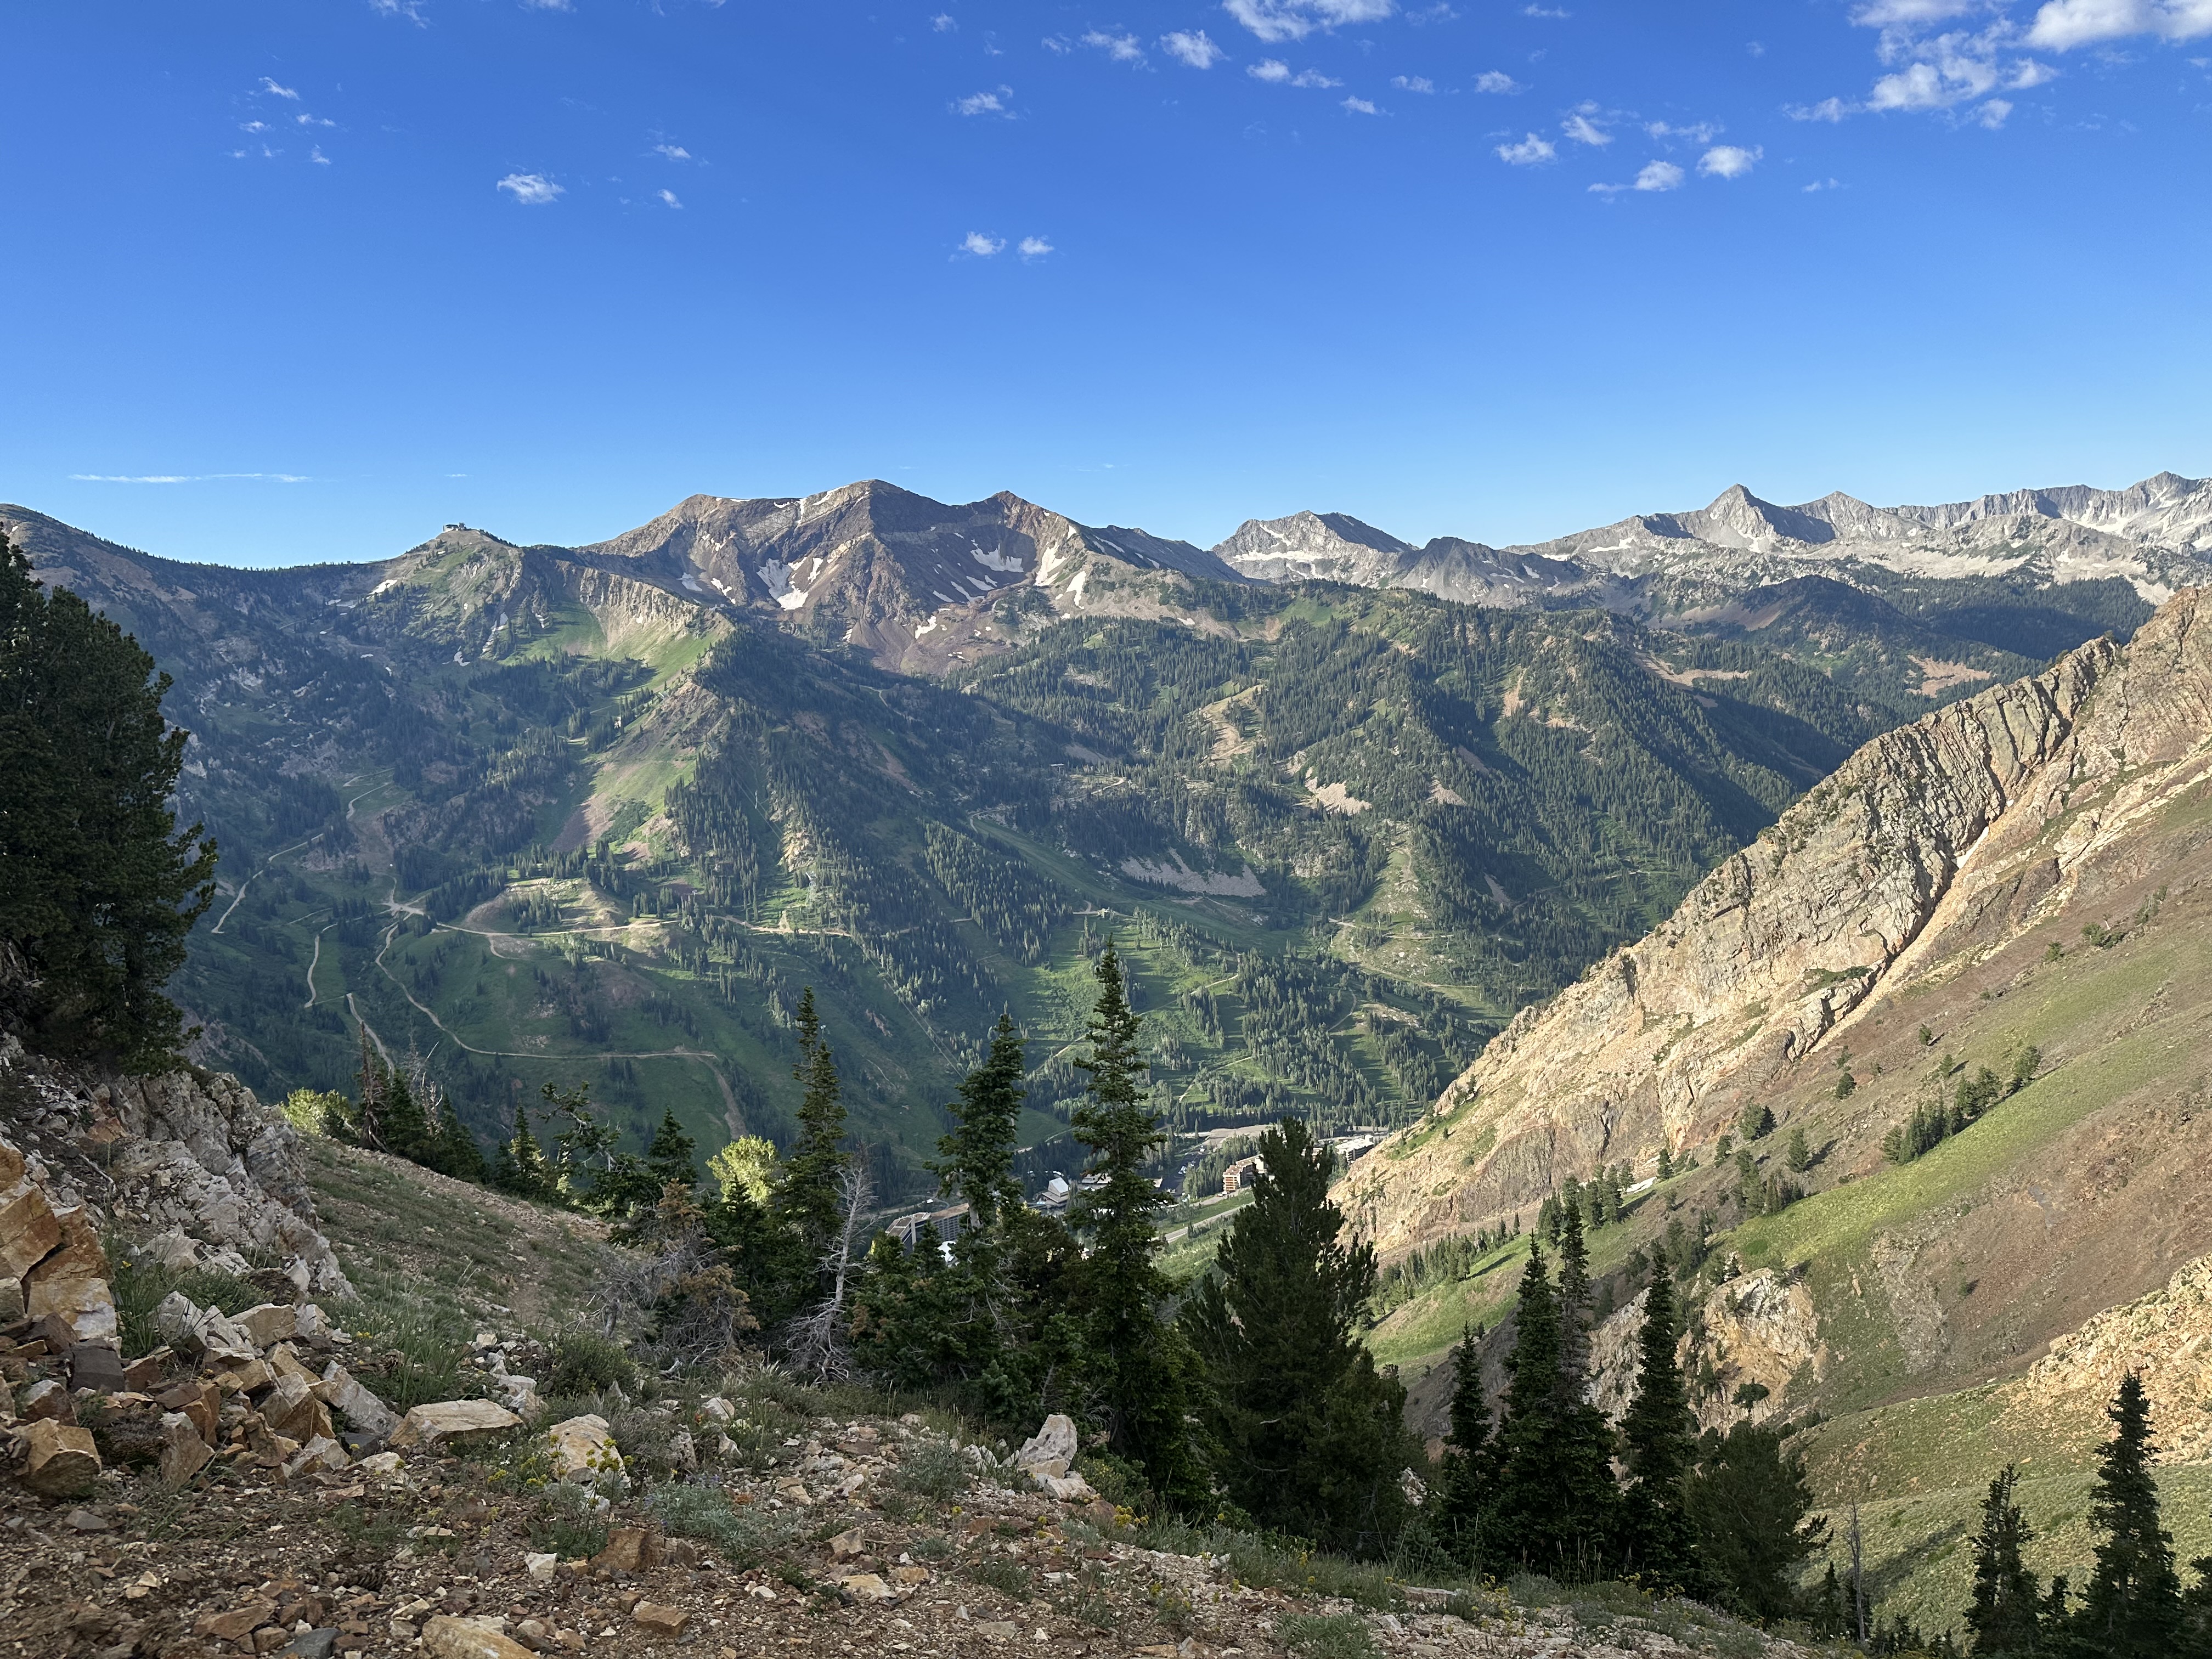
Easy to understand reports of how vegetation changes throughout the Wasatch

How to Read Our Maps

Read this to understand how we make our maps and how to read them.

NDVI Map
Guide How to Read Our Maps Understand how we produce our maps, what the colors mean, and how to interpret NDVI values in a real-world context. View Full Guide

Monthly Reports

April 2026 NDVI Map
Monthly Report April 2026 The April 2026 Wasatch Watch report tells a story of a green-up that stalled. After March's dramatic early surge, April added only a modest +0.0043 mean NDVI month-over-month โ€” effectively flat for a period when vegetation growth is typically near its annual peak. The NDVI trends graph confirms this: April's z-score barely moved from March's, suggesting the rapid green-up that began ahead of schedule has plateaued rather than accelerated. A late-month cold front is the likely culprit, offsetting the continued warmth at lower elevations that would otherwise have pushed NDVI higher. View Full Report
March 2026 NDVI Map
Monthly Report March 2026 The March 2026 Wasatch Watch report documents a striking early green-up across the Wasatch Front, with NDVI rising both month-over-month (+0.039 from February) and year-over-year (+0.073 from March 2025). Raw NDVI values for March 2026 already rival what is typically observed in late April or early May, a clear sign that vegetation is blooming well ahead of schedule. The seasonal anomaly map confirms March 2026 averaged approximately +0.058 above the historical March mean, with the most pronounced gains concentrated around the Utah Lake and Provo corridor. Month-over-month, the strongest increases occurred in lower-elevation desert and wetland areas west of and around the Great Salt Lake, where warming temperatures and residual February moisture drove rapid vegetation response. Scattered patches of NDVI decrease in the central corridor are attributed to lingering snowpack, masked vegetation, or urban heat island effects in areas such as Park City although these are localized relative to the broader regional increase. View Full Report
February 2026 NDVI Map
Monthly Report February 2026 February 2026 showed a clear NDVI decrease from January 2026, particularly in the arid areas, driven by drought and stressed vegetation, while the mountainous areas of the Wasatch Front exposed vegetation due to lack of snow rather than actual new plant growth. Compared to February 2025, mountain regions appear largely greener and even the Salt Lake Valley region increased slightly, while Western regions slightly decreased due to snow drought conditions. Additionally, this February was anomalously vegetated compared to historical Februaries, suggesting a possible early green-up View Full Report
January 2026 NDVI Map
Monthly Report January 2026 January 2026 showed a clear NDVI increase from December 2025, particularly in mountainous areas, driven by snowmelt exposing vegetation rather than new growth. Compared to January 2025, mountain regions appear greener while valley regions declined slightly, a pattern consistent with ongoing snow drought conditions across the region. View Full Report
December 2025 NDVI Map
Monthly Report December 2025 Despite seasonal expectations, NDVI was anomalously high compared to historical Decembers, driven not by healthy vegetation but by a conspicuous absence of snowpack. Mountain areas appeared greener than usual while valley and arid zones showed slight vegetation stress, a spatial divergence consistent with drought conditions at lower elevations and reduced snow cover at higher ones. View Full Report